

View Live Example
Overview
Dual axis charts allow you to correlate two different metrics using independent Y-scales. Cristalyse offers full support for dual axis configurations across various chart types, providing a complete view of complex data relationships.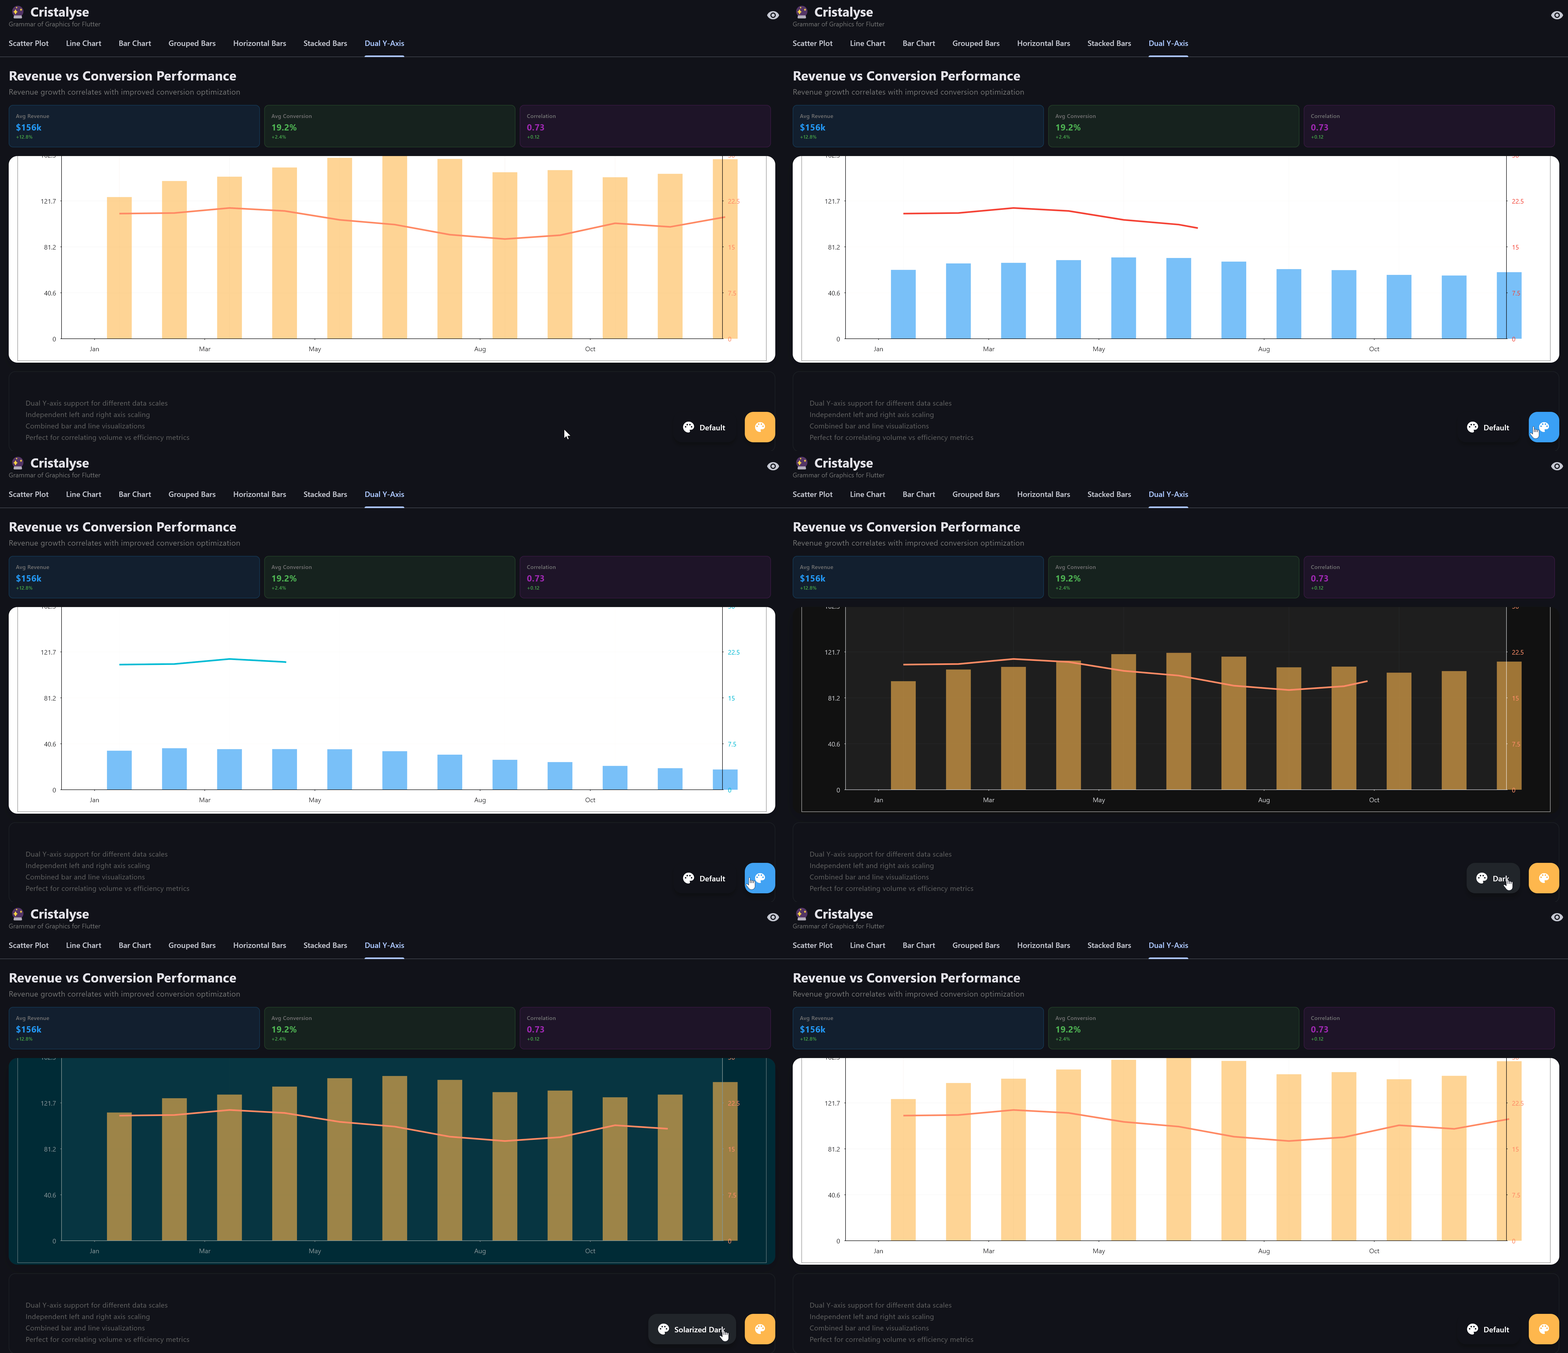
Basic Dual Axis Chart
Combine bars and lines with dual Y-axes:Stacked Dual Axis Example
Utilize dual axes with stacked bars:Interactive Features
Hover and Zoom
Add interactivity to enhance data exploration:Styling Options
Customize colors, scales, and styles to match your needs. Dual axis charts provide flexibility in how data series are presented, whether using bars, lines, or points across primary and secondary axes.Best Practices
Selecting Metrics
Selecting Metrics
- Choose complementary data series for dual axis charts
- Ensure the scales’ units are relevant and helpful
Design Considerations
Design Considerations
- Keep the design clear with distinct colors
- Avoid information overload - focus on key metrics
Performance
Performance
- Limit the number of points displayed for clarity
- Use staggered animations for smoother rendering